Visualising MPLS-TE Networks
imported Code · Tech · MPLS · MPLS_TE
For all network deployments, there is a requirement to present information relating to both topology, and various utilisation statistics to some human operator. In many cases, this process has become so ingrained in network requirements that there are almost ubiquitous solutions to the visualising data - for example, link utilisation is almost always presented via some framework or tool powered by RRDTool. Other tools, such as network "weathermap" diagrams linking this utilisation information into an overview of a network topology are also seen in many NOCs. In most cases, the problem of visualising data relating to a flat MPLS or IP network is solved for most common deployments.
The problem of data presentation is somewhat altered in the case of an MPLS-TE network. Whilst link utilisation graphs, and weathermap diagrams may continue to provide useful information, suddenly the overlaid tunnels within a network are of interest to operators. Whilst a first-line NOC engineer may not be aware of what is indicated by a certain LSR becoming a midpoint for a large number of tunnels within a network, this almost certainly identifies some form of failure, or congestion that should be reacted to. In addition to identifying events such as TE LSP path changes to particular nodes, it is often useful to retain some insight into the constraints within which CSPF is currently selecting paths for LSPs. In order to solve these problems, there's a requirement for an additional set of visualisation tools. In some cases, these tools may be implemented using existing visualisation tools - however, this often results in overly-complex presentations. The intent of this post is to outline some of the challenges, and interesting methods that appear to be available for presenting data relating specifically to MPLS-TE networks - a number of beta-quality solutions in use within AS5413 are presented, however, this post does not intend to define a complete solution.
In order to properly consider the available solutions to any visualisation problem, the data to be presented to an operator needs to be defined. Ideally, the information that is required by an operator is likely to include the following:
- The path taken by specific TE LSPs throughout a network -- within an straight MPLS or IP network, it is likely that there is a relatively easy set of nodes through which traffic is forwarded, since within a TE deployment paths are dynamic according to constraints, rather than following the shortest-path, then the presentation of path information to a human is of operational benefit.
- The resource consumption on any TE-enabled path -- this requirement is likely to include the presentation of resource utilisation over a specific link by reservations associated with a TE LSP. However, it should also view of the resources consumed by a specific TE LSP, both in terms of reserved bandwidth, and actual traffic forwarded in the interface
- Efficiency of path selection across a MPLS-enabled topology -- in many cases, TE is deployed in order to ensure that service level guarantees are upheld. Since typically, these guarantees are made in terms of loss, latency and jitter, the effect of TE path selection on forwarding between specific points in a TE network is of interest to an operator. Where the 'efficiency' of path selection is referred to, this should be interpreted as the proximity of path selection in the network to the optimal path throughout a network (this should be assumed to be the shortest-path as would be selected typically by an IGP).
A significant limitation of producing static images such as the example above, is that it is difficult to visualise changes between egress interfaces. The node in the example is a midpoint for a small number of nodes running MPLS TE - during the time at which the example output was gathered, a small number of test PEs had been deployed with automatic bandwidth adjustment on each TE LSP, and hence the number of TE reservations is relatively small. In order to determine egress paths for each LSP on the node, and hence determine the cause of any imbalance across equal-cost paths, a diagram such as this can be useful. However, to properly view the changes in paths over time, a relatively large number of diagrams of this nature need to be examined. It is likely that a better result would be achieved by having some form of dynamically updating graphic representation.
The second type of diagram requires a topological view of the network - it is almost impossible to represent all TE paths for which a specific node is the head-end in a network on a single diagram whilst retaining a clear, easy-to-parse image. Producing per-LSP diagrams is possible, but again produces some difficulty in representing the changes of path for an LSP. Diagrams can quickly become convoluted if all possible paths are included. For example, the diagram below shows all possible NHOP and NNHOP LSRs for a specific node within the AS5413 network topology. Where there is a secondary device via which all nodes can be seen, the topology becomes relatively complex very quickly. The problem of finding a computational method to produce layouts that are clear for human interpretation is relatively complex, with Graphviz being the standard OSS tool utilised for this purpose.
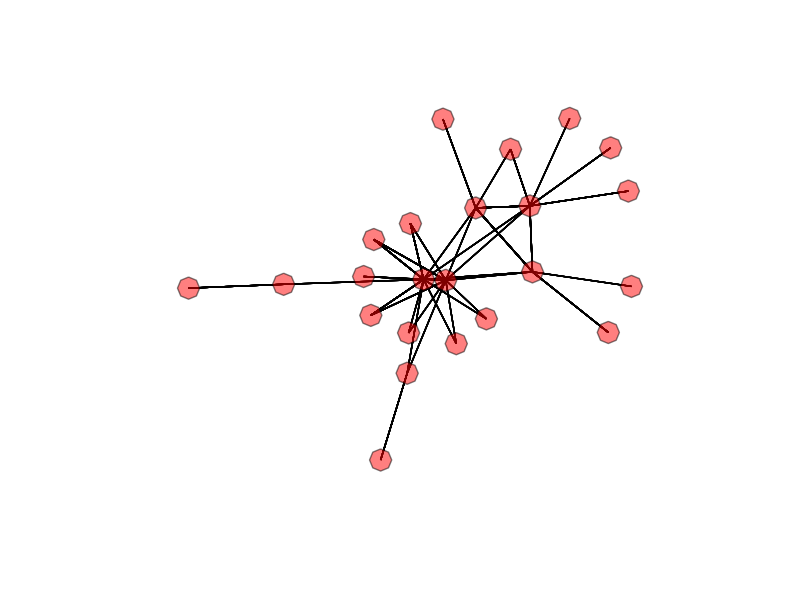
Should there be a requirement to scale a diagram such as the example above to show all possible nodes via which a TE LSP may be routed, and overlay the actual path taken, then a large number of diagrams are likely to be required. In addition, the information presented to an human is unlikely to be easy to parse. Again, a requirement would appear to exist for dynamic means of displaying information, and the ability to adjust an image to show specific nodes or paths of interest would be advantageous.
The second requirement in the list above is somewhat easier to solve, as it mirrors existing visualisations that are utilised for a straight IP/MPLS network. A weathermap-type topology diagram, where each link is marked according to the reservations made on it can easily display information relating to the size of reservations on specific interfaces. Additional information can be shown in such a topology diagram by adjusting the display of specific nodes to reflect the number of LSPs carried. Such a solution can be implemented with relatively minor changes to existing tools such as Network Weathermap. It should be noted that this is likely to require human interaction to develop a set of topologies with a network that are of interest to those using such a weathermap - for instance, certain NOC engineering teams may require specific topologies - or specific subsets of nodes. Displaying every PE within a relatively large network on a single diagram is unlikely to provide useful information to an engineering team.
To monitor SLGs within a network (as per the third requirement above), typically, some form of graphing of an IP SLA probe, or some end-to-end ICMP graph (via a tool such as SmokePing) is used. It is likely that such implementations can continue to be utilised to support SLAs. However, the problem of displaying efficiency of path selection within a network is not as trivial to solve, and indeed is unlikely to ever be a requirement in a network where a packet is routed according to an SPF algorithm. This is not something that has been implemented within AS5413 currently, however, it would appear that some interesting approaches do exist - for example, Karol Kowalik and Martin Collier from Dublin City University present an eye-diagram approach to displaying the efficiency of path selection throughout a TE network. Within their paper, they note that this approach does not scale easily to TE networks above 30 nodes, however, since there appears to be no open reference implementation for this method, it hard to evaluate its performance. This paper appears to be one of the few approaches to showing path efficiency through a TE network that has been discussed.
The post's intention, as discussed, is to present the small number of solutions, and their limitations that have currently been implemented at AS5413 - clearly, these tools are not production quality, or complete at the current time. If there is interest in providing a non-commercial solution (as an alternative to solutions like OPNET, and the Cisco TE tools) that provides information for small to medium SPs, where such an investment does not seem justified, then there may be a possibility to push some collaborative OSS visualisation tools. If you, or your organisation have any such interest, please let me know via the comments.