The Right-Sized Tool: Building Software with 100% AI
tech Tech · AI · LLM
Every engineer knows the familiar frustration of needing a tool that doesn’t quite exist.
Recently, I found myself wanting to perform some specific cycling data analysis. It wasn’t an incredibly complex data science problem, but it required a tailored approach. Looking at the landscape, I faced a frustratingly common modern dilemma.
The existing platforms out there aren’t badly built or inherently bloated. In fact, many are brilliant. Take intervals.icu as an example: it is an incredibly powerful, deeply capable platform for endurance sports analytics. It tracks everything from CTL and W’ balance to heart rate recovery and custom charts. It is an amazing tool.
But because it has to be everything to every athlete, it is inherently complex. It presents a mountain of data that can be intensely difficult to parse if you aren’t a full-time sports scientist.
On top of this, trying to overlay modern AI capabilities onto that setup is clunky. To get a simple, AI-powered coaching insight out of my data, I found myself taking screenshots of my charts and uploading them into Gemini. The data was trapped inside the tool’s interface, and not in a way that I could interact with easily or use for other purposes.
I didn’t want to navigate a massive learning curve to use 5% of a platform’s features, and I didn’t want to keep pasting screenshots into a chat window. I wanted a right-sized solution that did exactly what I needed, natively. Historically, this would have been possible, but something I was unlikely to do – I’d have needed to spend significant time developing something – so I’d have lived with the tool, or given up. Instead of doing either of these, I decided to see whether the age of LLMs offered a different path.
So, I ran an experiment. I wanted to see if I could build a highly specific tool without writing a single line of code myself. The result is directeur, a data analysis tool written 100% by AI.
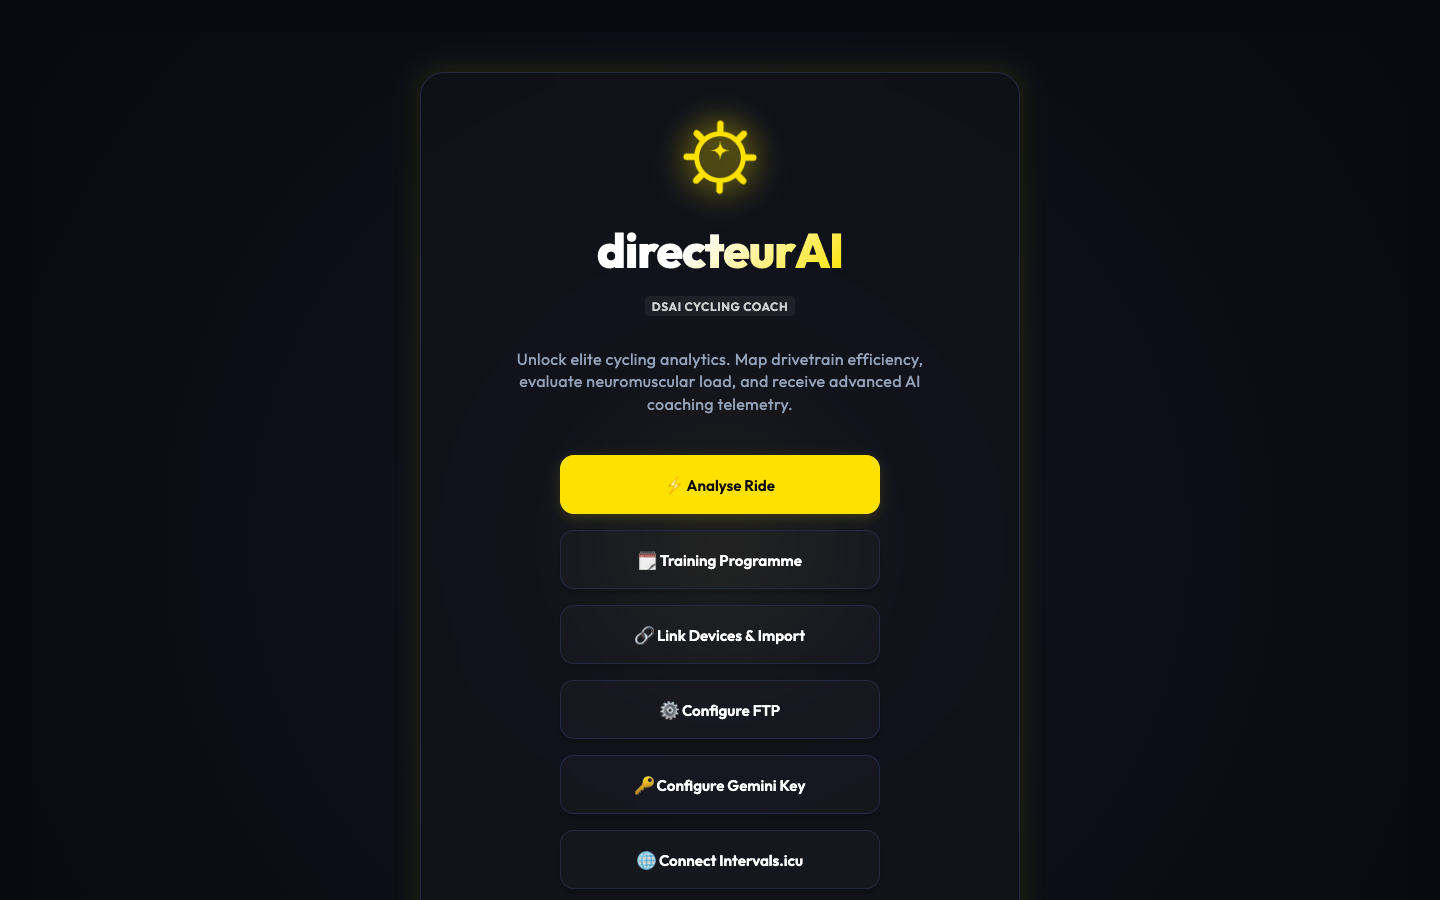 The workspace layout when you open up directeur.
The Experiment: Architect, Not Coder
To build directeur, I used Antigravity and Gemini. My ground rule was strict: I wouldn’t write the code. I haven’t spent time learning the intricacies of the underlying services this tool integrates with, nor did I want to.
Instead, my role shifted. I became the product designer and the system architect. I defined the features, sketched out how they should work, and mapped the data flows. I guided the AI through the technical choices, for example: building the core engine in Go, suggesting libraries that should be used (e.g., for FIT parsing), and generating a local HTML dashboard using Chart.js to visualise it.
When things broke – whether it was handling Go module dependencies or data encoding mismatches – I acted as a high-level debugger, feeding logs back to the AI and letting it figure out how to mutate its own code to make it work.
Because the code was completely AI-driven, changing the system was as simple as shifting my intent. I could focus on subtle, personalised details that would usually feel like too much effort to hardcode manually.
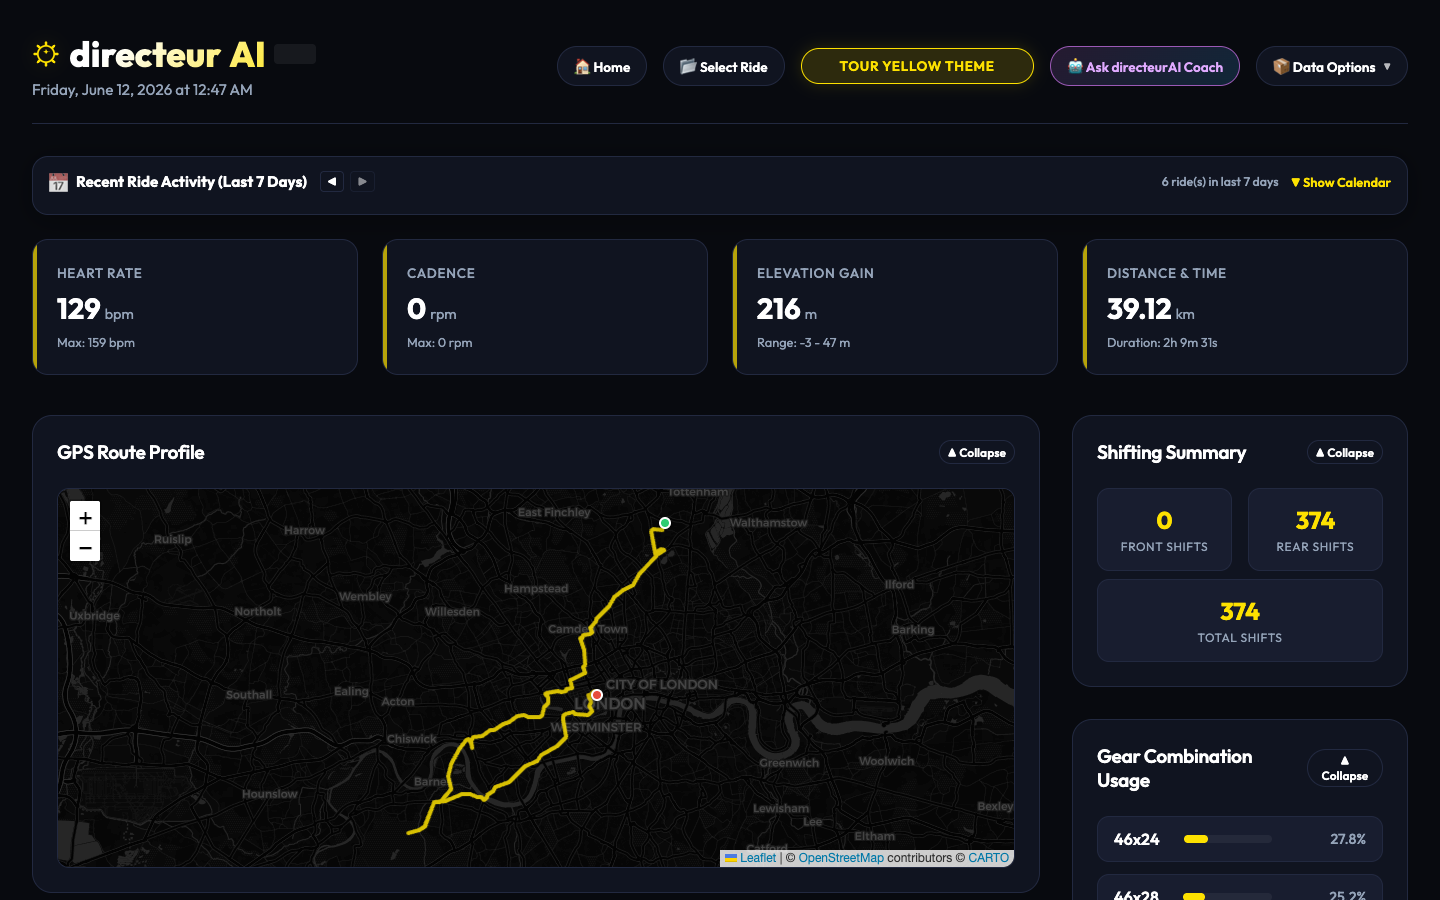 The main analytics dashboard showing parsed telemetry charts.
The telemetry views focused strictly on what mattered to me – from targeted power and routing visualisations to precise shift profiling and dynamic performance breakdowns.
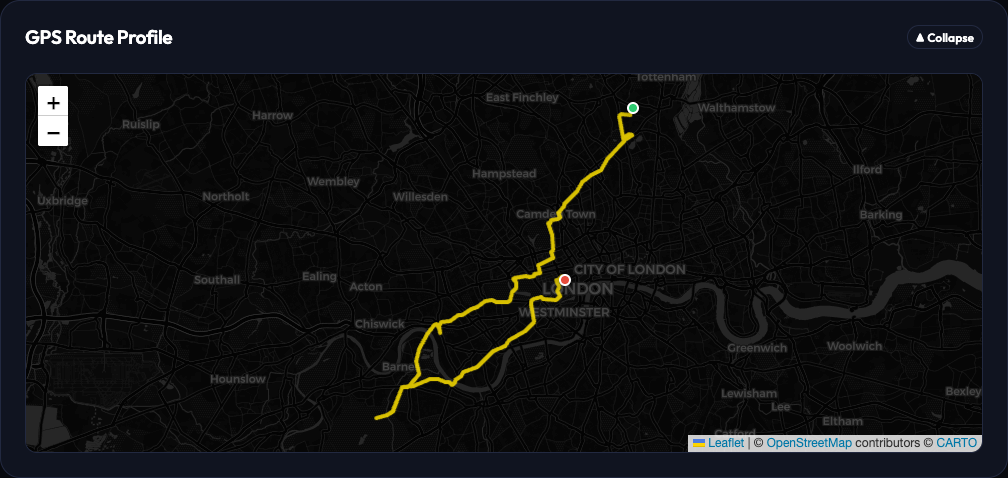 Mapping the coordinate telemetry directly alongside my power metrics.
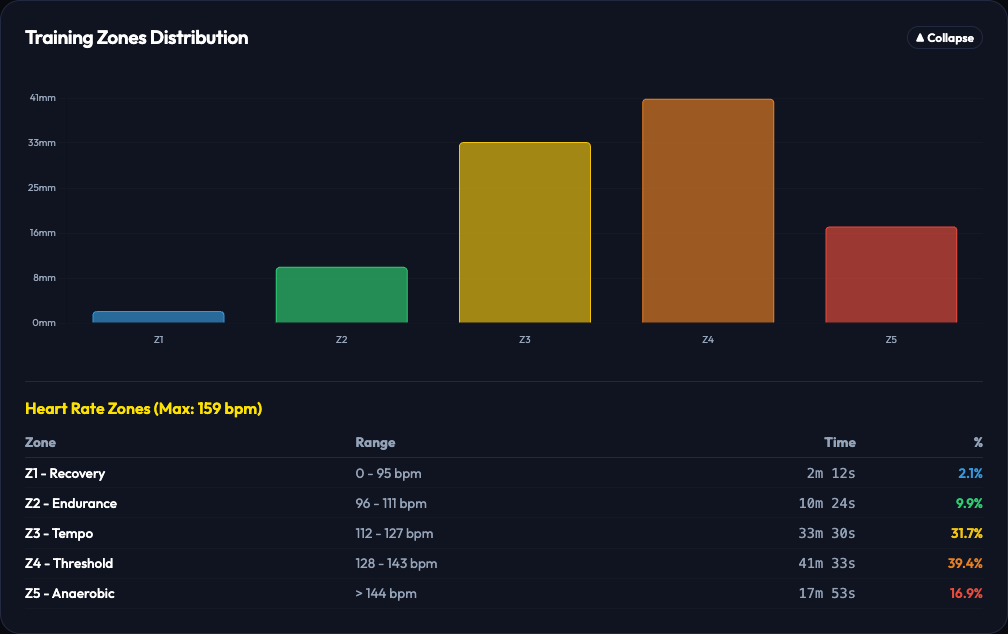 A straightforward power distribution zone breakdown without the extra platform metadata clutter.
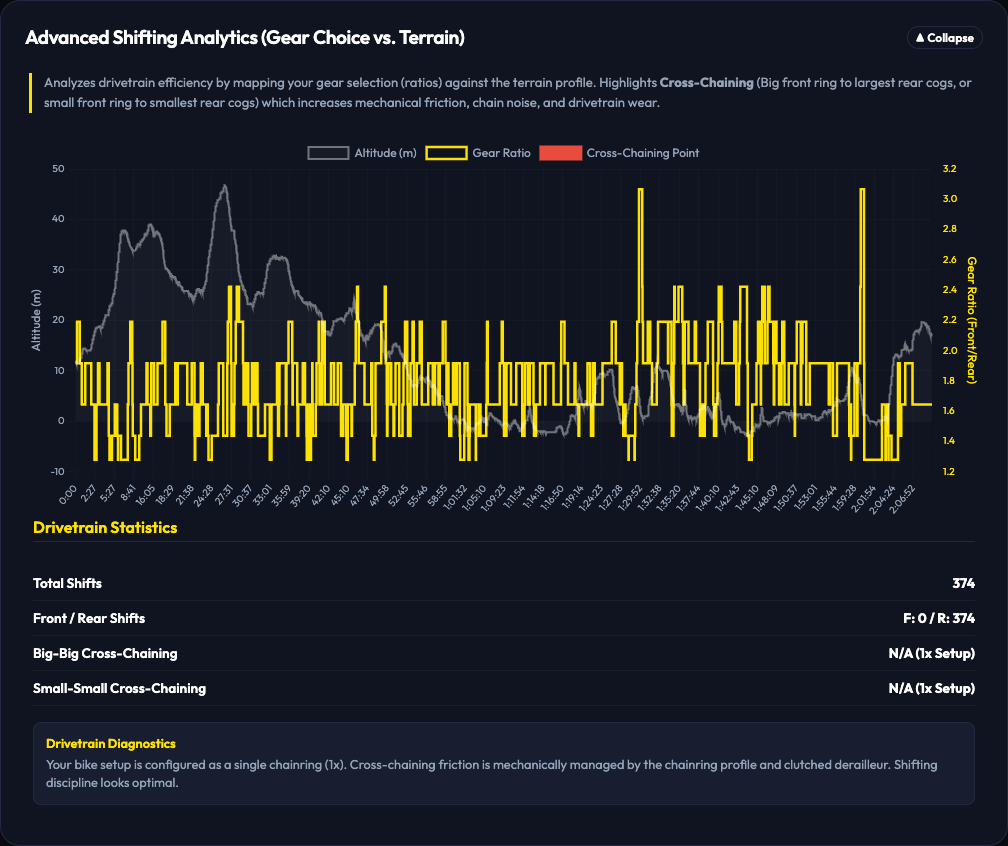 Drivetrain analytics showing exact gear selection spreads and durations.
For instance, I asked the AI to dynamically adapt the dashboard’s visual theme based on the cycling racing calendar: Flandrian classics colours for spring, Giro Pink in May, Tour Yellow in July, and Vuelta Red in August.
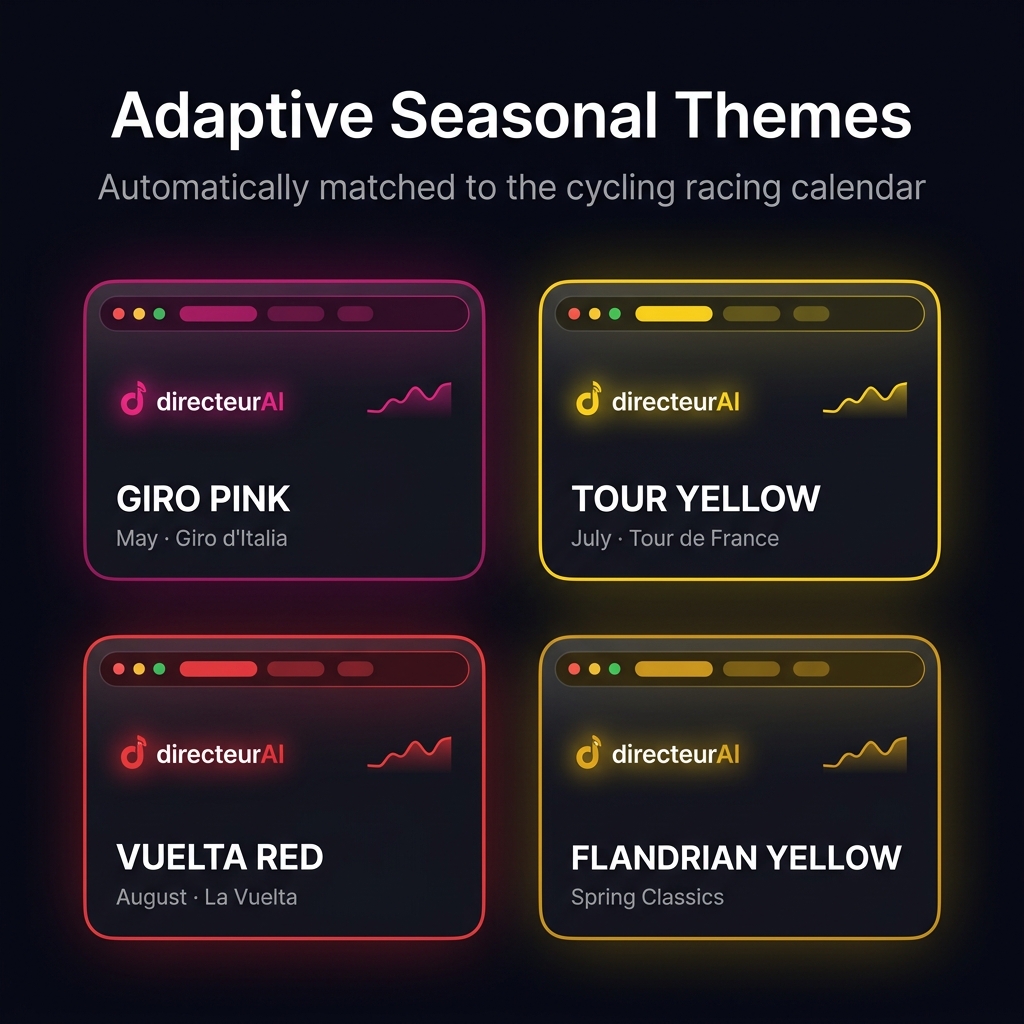 The same ride analytics, automatically re-themed depending on the month the ride happened.
I also integrated a native “AI Coach” panel directly into the dashboard. Instead of messing with a heavy backend infrastructure, the application packages the parsed drivetrain diagnostics and power telemetry straight from the browser and sends it to the Gemini API using an API key stored locally. The software effectively became a lightweight runtime bridge between raw binary .FIT hardware data and an LLM.
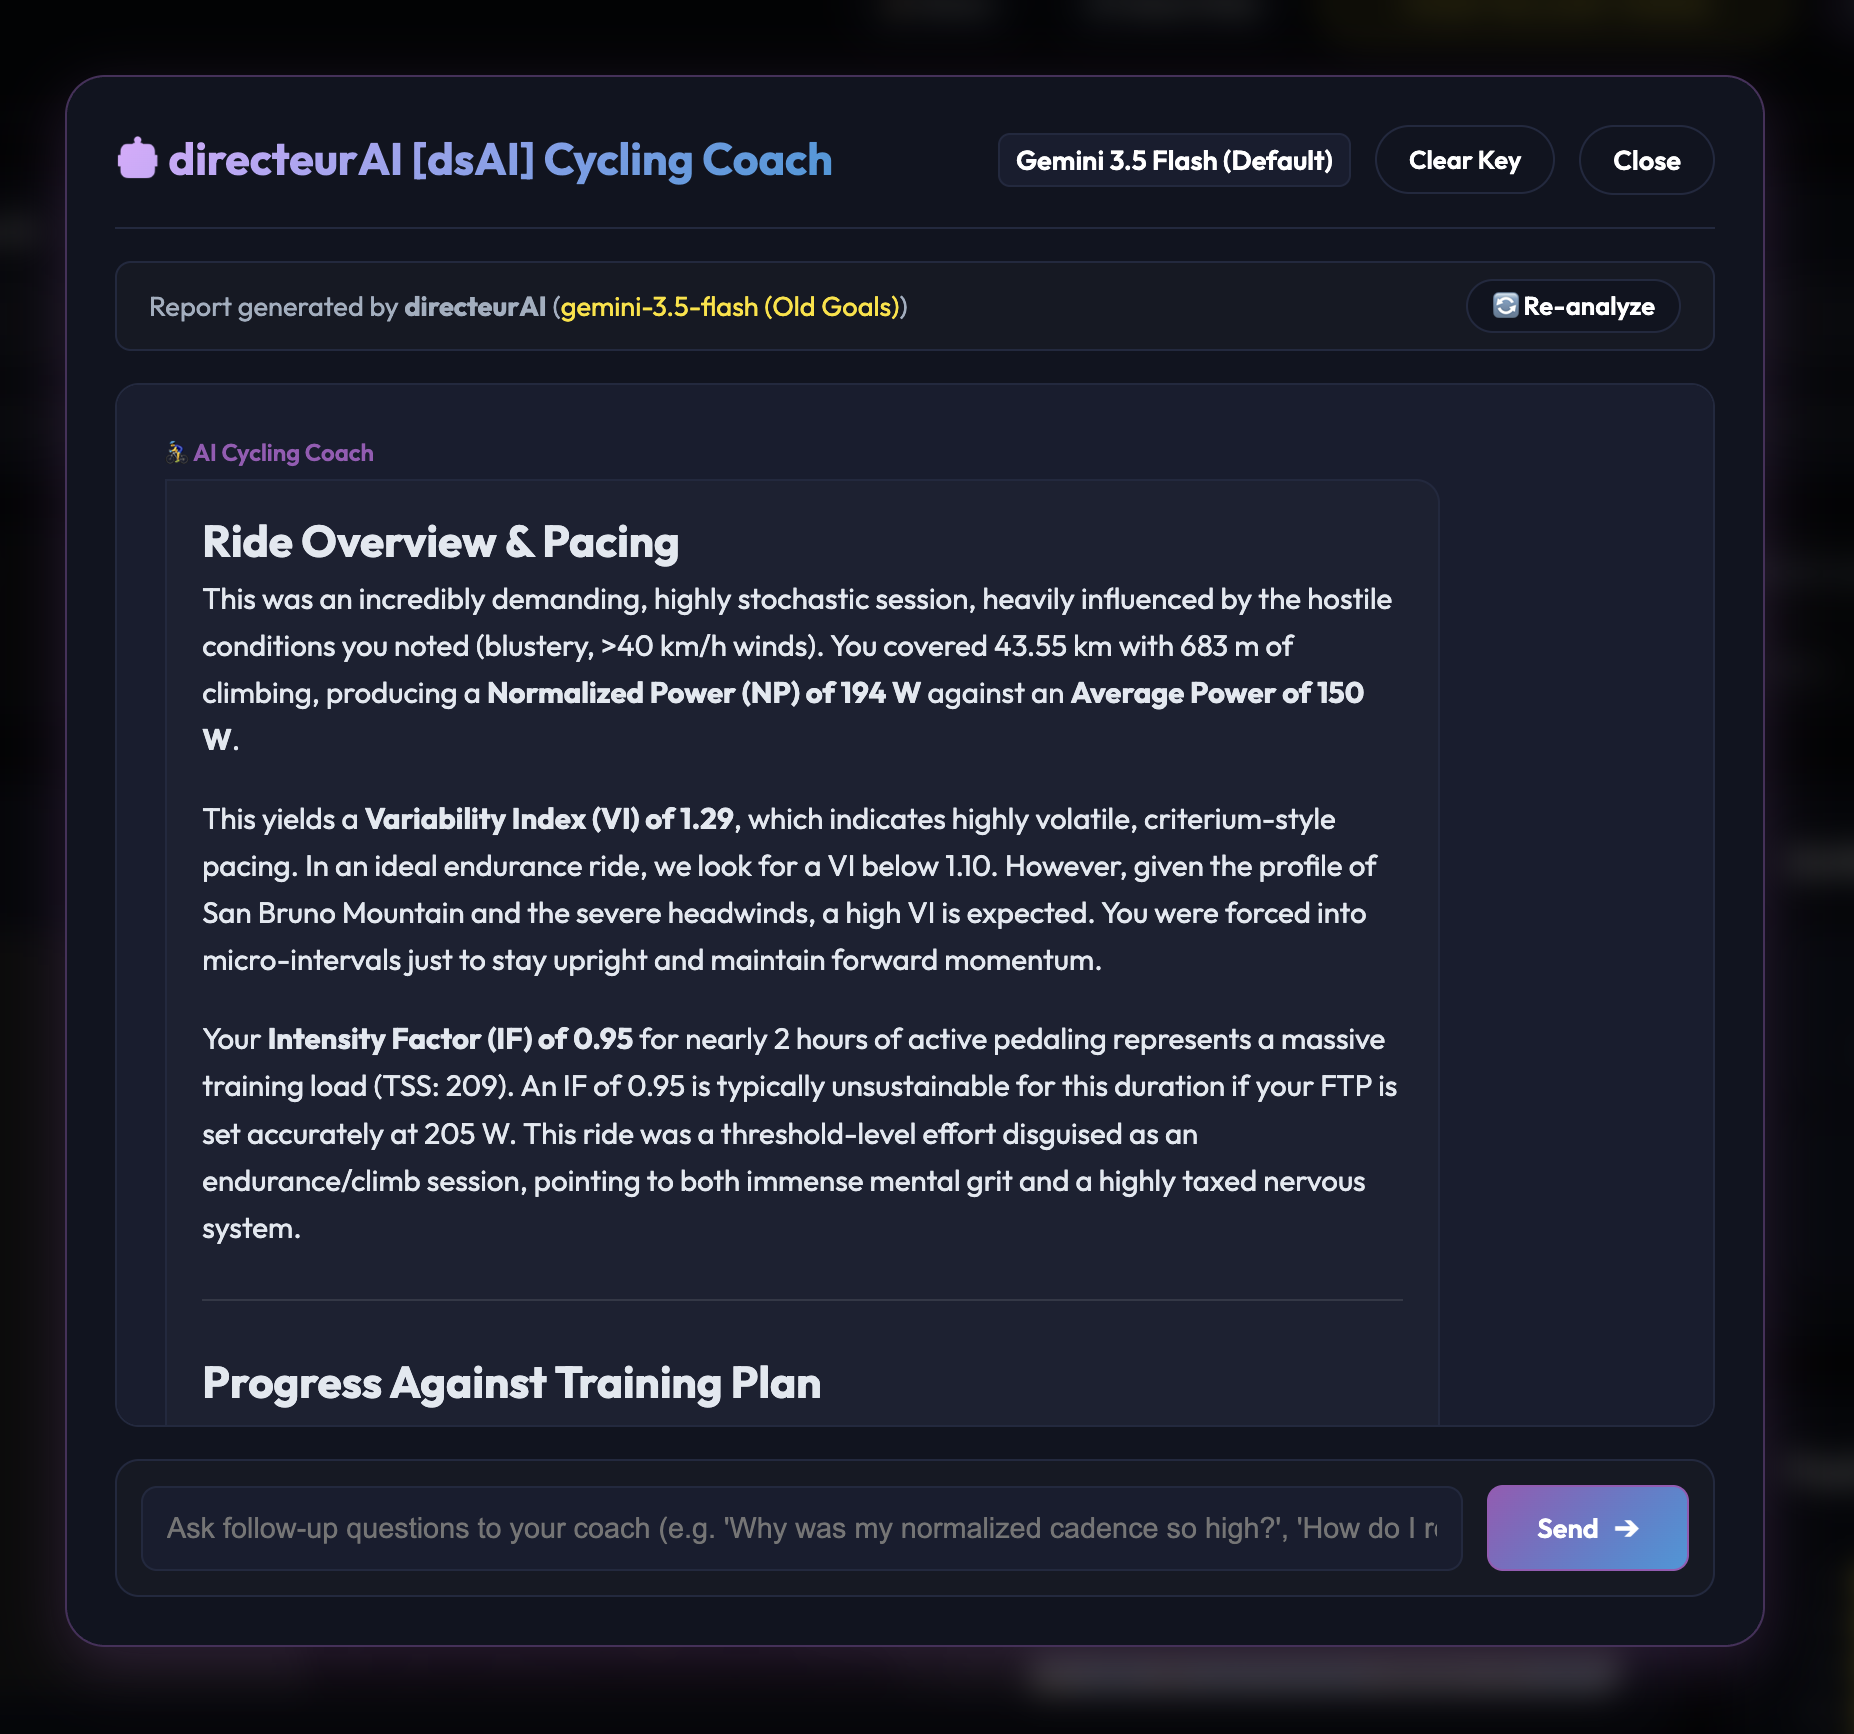 Interacting with the local coach block straight from the dashboard data context.
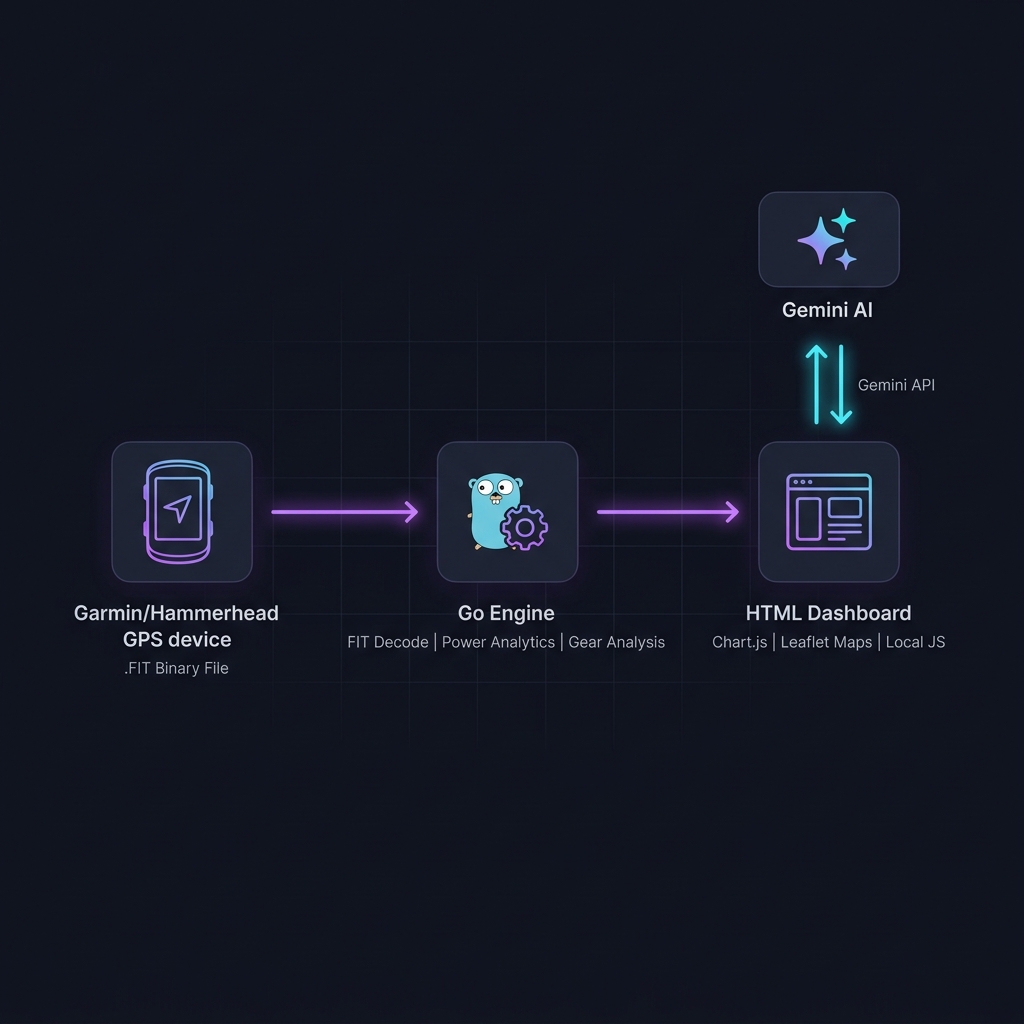 The systems architecture layout for keeping the data path entirely local.
Right now, there’s an obvious caveat to this story. I spend my days working as a SWE at Google. Knowing how systems should be structured, how data should flow, and how to interpret an error log closure undoubtedly made it easier to guide the AI to the finish line. But this is a lagging indicator. The capability curve of these models means that this process is getting exponentially easier.
We are rapidly approaching a point where users without any software engineering experience will be able to do exactly what I just did.
When anyone can prompt a perfectly tailored, right-sized application into existence, the fundamental approach to building applications changes – both in terms of technology and economics. This shift carries two massive implications.
1. The Shifting Moat of Platform Complexity
Software platforms have scaled by aggregating features to satisfy the entire market. If a platform wants to capture more users, it must add more switches, more dashboards, and more edge-case support.
But if a user can simply use an AI to spin up a lightweight, bespoke alternative that pulls raw data and does only the three things they care about – like parsing gear ratios and cleanly pushing workouts directly to the intervals.icu API – the value proposition of navigating a massive, multi-tenant interface drops significantly.
This means platforms will have to find entirely new ways to differentiate themselves. You can no longer just build a complex interface, expect users to navigate a plethora of functions, and call it a product moat. Platforms will instead need to differentiate on deep, programmatic capabilities: pristine raw data access, robust APIs, and foundational infrastructure that AI agents can seamlessly leverage. The value moves from the dashboard to the data layer.
2. Self-Evolving Software at Runtime
The second implication changes how we think about the lifecycle of an application entirely.
The traditional (;-)) AI development workflow – asking an external AI to write some code, reviewing it, and committing a new feature to GitHub – is still bound to traditional development paradigms. The next logical step is to bring the AI directly inside the application execution environment itself.
I wanted to see whether, instead of manually modifying the source code to design a new analysis graph or handle a new data type every time my curiosities shift, I could just ask directeur itself to evolve at runtime.
To test this, I had the AI build a simple feature injection mechanism into the dashboard. You look at your data, and type an arbitrary question into a local prompt bar – for example, asking for a dual-axis chart that correlates gear selection directly against cadence on climbs over 8%. Rather than running a pre-baked data filter, the dashboard handles it dynamically:
- It packages the raw data structures of the current
.FITfile context. - It sends the layout data alongside your raw question straight to the Gemini API using your local browser key.
- The model acts as a real-time front-end engineer, writing a custom client-side JavaScript snippet or a completely fresh Chart.js canvas configuration tailored to that precise query.
- The dashboard executes the payload locally, immediately drawing a brand-new, functional visualisation panel straight into the UI grid.
Watching the dashboard generate a custom graph configuration purely based on a specific text prompt.
This isn’t a transient sandbox. The application stores these freshly compiled components as persistent objects inside the browser’s local storage. If you reload the tab or check a different ride file tomorrow, your custom charts are still sitting exactly where you left them, reading the new dataset seamlessly.
The development process works as an iterative conversation. If the model introduces a bug or generates raw JavaScript that throws a chart error, the dashboard wraps the execution inside a local try...catch block. Instead of crashing the page, it exposes a small UI panel that catches the exact string exception data and ships it straight back to Gemini. The model automatically handles the refactoring, corrects its code bugs, and updates the canvas on the fly.
You can also use the same text interface to continuously shape existing custom views over time – prompting changes like “Add a secondary Y-axis for heart rate” or “Change the line colour scaling” to layer new features on top of what it previously built.
The application you open in the morning isn’t the same application you close at night. It stops being a static tool where you have to navigate an endless checklist of settings; it morphs on the fly to fit the exact contours of the questions you ask it throughout the day.
The application workspace restructuring its UI grid elements to render a fresh, localised visualisation block.
Shifting the Weight
Building directeur convinced me that the era of forcing users to adapt to massive, complex feature suites is drawing to a close. Platforms like intervals.icu will always be valuable because of the incredible depth they offer, but the way we interact with that depth is going to change.
When the friction of writing code drops to zero, software will finally conform entirely to the individual user, rather than the user conforming to the software.